Description
Prometheus is a powerful monitoring system specifically designed for collecting and processing metrics from various infrastructure components, such as servers, databases, and microservices. Prometheus supports data collection via HTTP requests, allowing it to integrate with most modern services and applications. With a rich set of features such as a flexible query language, automatic alerts, and metric visualization, Prometheus helps track system health and identify potential issues. This tool is indispensable for DevOps teams as it provides detailed monitoring and supports integration with other systems like Grafana for data visualization.
Getting started
1. Deploy a server with Prometheus from the Marketplace.
Log in to the newly created server via SSH. If you don’t know how to do this, refer to the instructions:
- Linux/MacOS - Connecting to VPS via SSH for Linux/MacOS
- Windows - Connecting to VPS via SSH from Windows
To log in, specify the password you set during the creation of the Prometheus server, or use the added SSH key. See: How to create an SSH key
2. Check the connection data.
After logging into the server you will see a message:
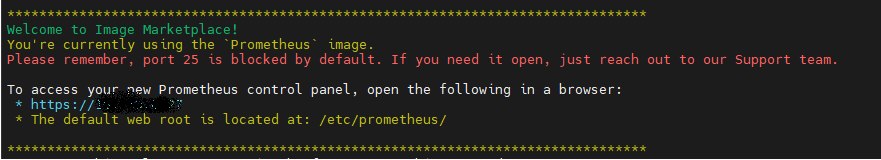
Prometheus Configuration and Settings.
The root directory of your Prometheus application is located at: /etc/prometheus/. In the /etc/prometheus/ directory, you will find all the configuration files necessary for setting up Prometheus. The main configuration file is prometheus.yml, where you can configure metric sources, alerts, and other system parameters. To edit it, run the following command in the console:
nano /etc/prometheus/prometheus.yml
3. Issuing an SSL Certificate for the Domain with Prometheus:
Note: Before setting up, ensure that your domain or subdomain for Prometheus points to the server’s IP address. To do this, you need to delegate the domain to our DNS or specify the location of your site on this new server. This means to bind the domain (subdomain) or point it to the new server. Follow the steps described in Zones (DNS).
To obtain a free SSL certificate from Let's Encrypt, run the following command in the console:
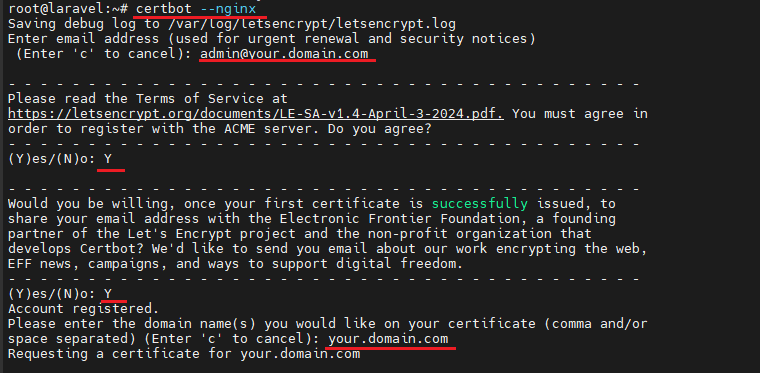
certbot --nginx
You will be prompted to enter your site details:
- Enter Your Email Address - specify your email address (e.g., [email protected]).
- Agree to the TOS (Terms of Service) - press “Y”.
- Domain/Subdomain name - enter the domain name. You will be asked to specify the domain name for your domain or subdomain.
- Example: your.domain.com, example.org (do not include www or http/https).
- Agree or not to the transmission of your email data - press “N”.
- Wait for the certificate to be issued. This process takes about 5 minutes.
4. Prometheus Control Panel
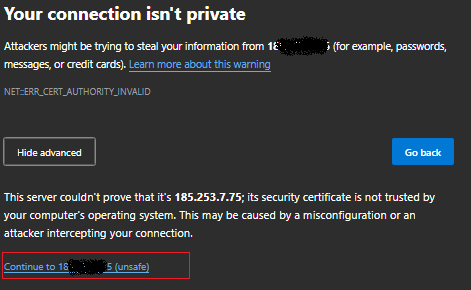
To access the Prometheus control panel in your web browser, go to the link. For example: https://11.22.33.44
Note: If you don’t have an SSL certificate yet, you will see a warning regarding the SSL certificate. You can safely ignore this. Just confirm the transition to continue opening the site.
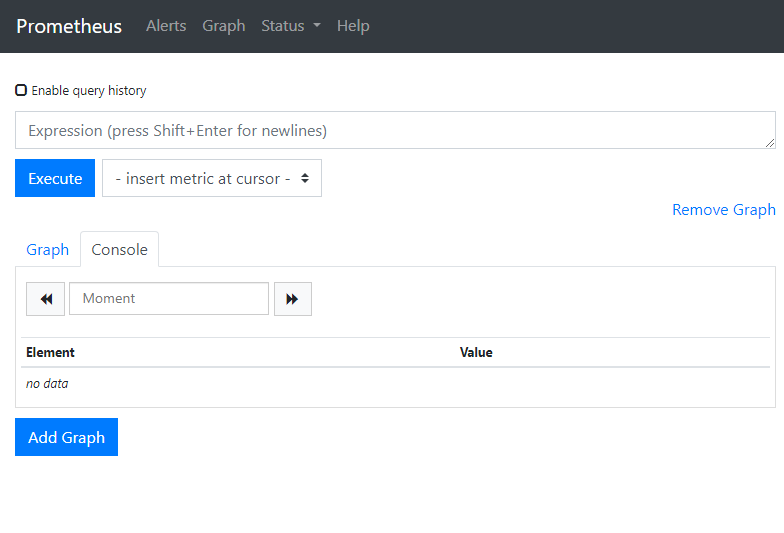
You will see the Prometheus page or your site:
Note: Be aware that port 25 is blocked by default. If you need to open it, please contact our technical support.
Prometheus is a reliable tool for monitoring infrastructure and collecting real-time metrics. Due to its flexibility, ease of use, and ability to integrate with other systems, Prometheus helps respond promptly to potential failures and enhances system performance. Be sure to set up alerts and visualizations to fully realize the potential of this tool. Use the instructions above to configure and manage your Prometheus environment.