Description
Zabbix is an enterprise-level open-source monitoring solution designed to track the performance and availability of servers, network devices, services, and other IT resources. Zabbix is a versatile monitoring tool that allows users to collect, store, manage, and analyze data obtained from the IT infrastructure. This data can be displayed on the screen and can also be used to send notifications via email, SMS, or Jabber when predefined limits are exceeded. With Zabbix, administrators can quickly identify issues with servers and devices, reducing system downtime and minimizing the risk of failure. This solution is actively used by both small and medium-sized businesses (SMBs) and large enterprises across various industries worldwide.
Getting started
Deploy the Zabbix server from the Marketplace.
Log in to the newly created server via SSH. If you don’t know how to do this, refer to the instructions:
Linux/MacOS - Connecting to VPS via SSH for Linux/MacOS
Windows - Connecting to VPS via SSH from Windows
Check the connection data.
To log in, provide the password you set when creating the Zabbix server, or add the SSH key. See: How to create an SSH key
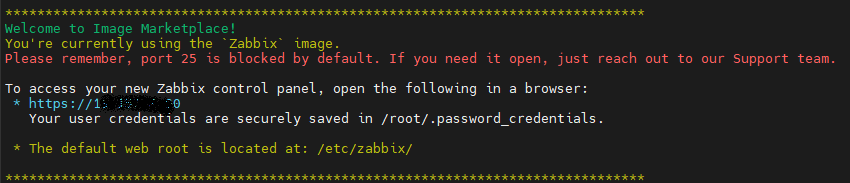
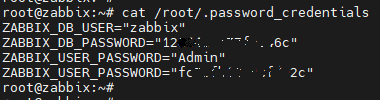
On the server, user credentials are stored in the file /root/.password_credentials.
To view your credentials for accessing Zabbix, run the command:cat ~/.password_credentials
orcat /root/.password_credentials
Initial Setup of Zabbix
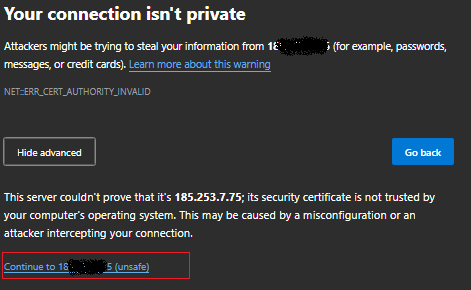
Go to the web interface at the following link. For e[amle this is your Zabbix site: https://11.22.33.44. If you see a warning about the SSL certificate, it’s normal and can be safely ignored; just confirm to proceed.
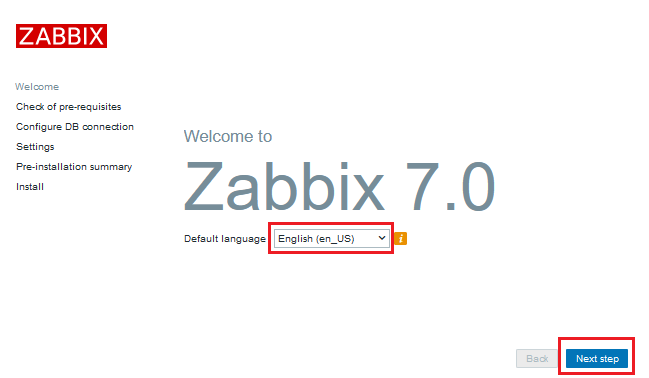
After logging in, you will be prompted to perform the initial setup of the server:
Choose the interface language that suits you.
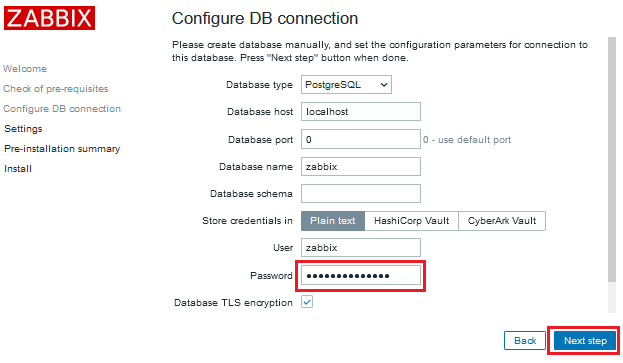
Check the status of connections to the database and other infrastructure. Provide access credentials from the password file.
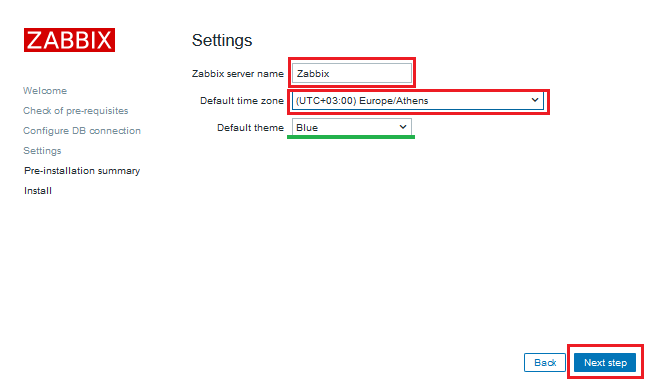
Specify the name of your Zabbix server and select your time zone.
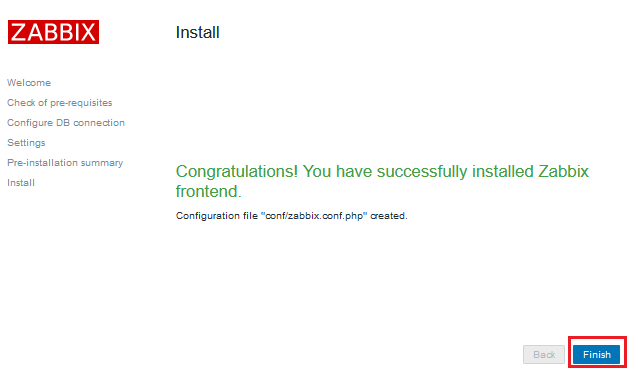
Click the “Finish” button to complete the setup:
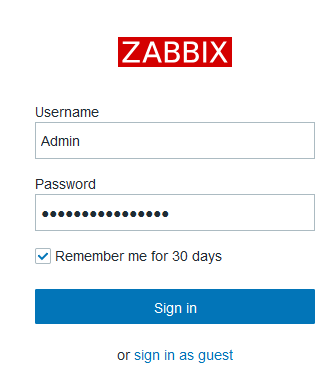
Login to Zabbix
After that, you will be directed to the login window for the Zabbix panel. Enter the username Admin and the password for it from the file:
Adding Devices for Monitoring.
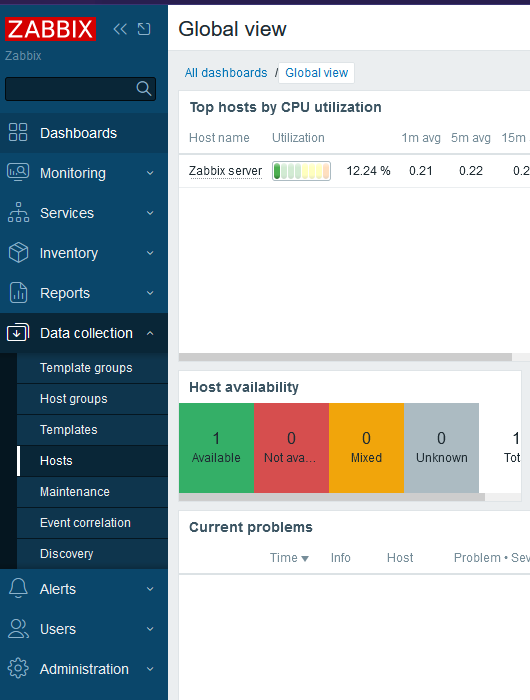
After successfully setting up the basic configuration, proceed to add servers, network devices, or services to monitor. In the left menu, select "Data collection" → "Hosts". Click "Create Host" and fill in the necessary information, such as host name, IP address, and group. Connect monitoring templates for automatic data collection.
Configuring Notifications: To set up automatic notifications (via email, SMS, or Jabber). In the left menu, go to "Configuration" → "Actions". Create a new action for notifications about critical events. Add trigger conditions to send notifications if a specific parameter exceeds the allowable threshold.
Installing the Zabbix Agent on Client Machines: To monitor additional servers or devices, you need to install the Zabbix agent on these machines. Installation instructions for the agent can be found on the official Zabbix website.
Monitoring and Reporting: After adding hosts and installing agents, the system will start collecting data. You can view graphs, server statuses, and receive real-time notifications through the web interface. Use reports to analyze the performance and availability of your infrastructure.
Note: Please note that port 25, used for outgoing mail, is blocked by default. To open it, please contact our support service.
After all these steps, your Zabbix server is ready for monitoring. You can further configure users, access rights, and enhance monitoring with additional plugins and templates. Now you can fully utilize Zabbix to monitor your IT infrastructure!